


Making Retail Data Analytics Work for Customers, Stores and Inventory
The five decisions analytics supports, the data checks that have to pass first, and how to tell whether the report changed anything.
 Yevhenii Sukhov·Publication date·15 min read
Category sales fell 9% last month. The merchandising report shows the drop. The stock system shows which lines were unavailable. The marketing platform shows spend went up. Three screens, three owners, and no answer to the only question that matters: what do we do on Monday.
Retail data analytics is the work of joining those screens so that a number leads to an action and the action can be checked afterwards. This article covers the decisions analytics supports and the four types of analytics, with when each is worth the effort. It then turns to the data underneath, the KPIs worth tracking and what a report has to do to be used. It ends with how to run the first project so the result is measurable.
Retail Data Analytics in Short
Retail data analytics joins sales, stock, customer and marketing data so that each number leads to a decision someone can check later. Start with one decision, such as how much to reorder, and read sales next to availability before acting on them.
What Is Retail Data Analytics?
Retail data analytics is the collection and analysis of sales, inventory, customer and operational data. It supports decisions about what to buy, how to price, where to put stock and whom to contact. It covers the whole business, where retail customer analytics covers the behaviour of shoppers and retail store analytics covers what happens in a physical location.
So what is retail analytics in day-to-day terms? Which lines to reorder is a question for retail data analysis. Why one branch converts worse than another is a question for analytics for retail stores. The data overlaps, but each question has a different owner and a different action.
Shopping analytics usually means the online slice of the same work.
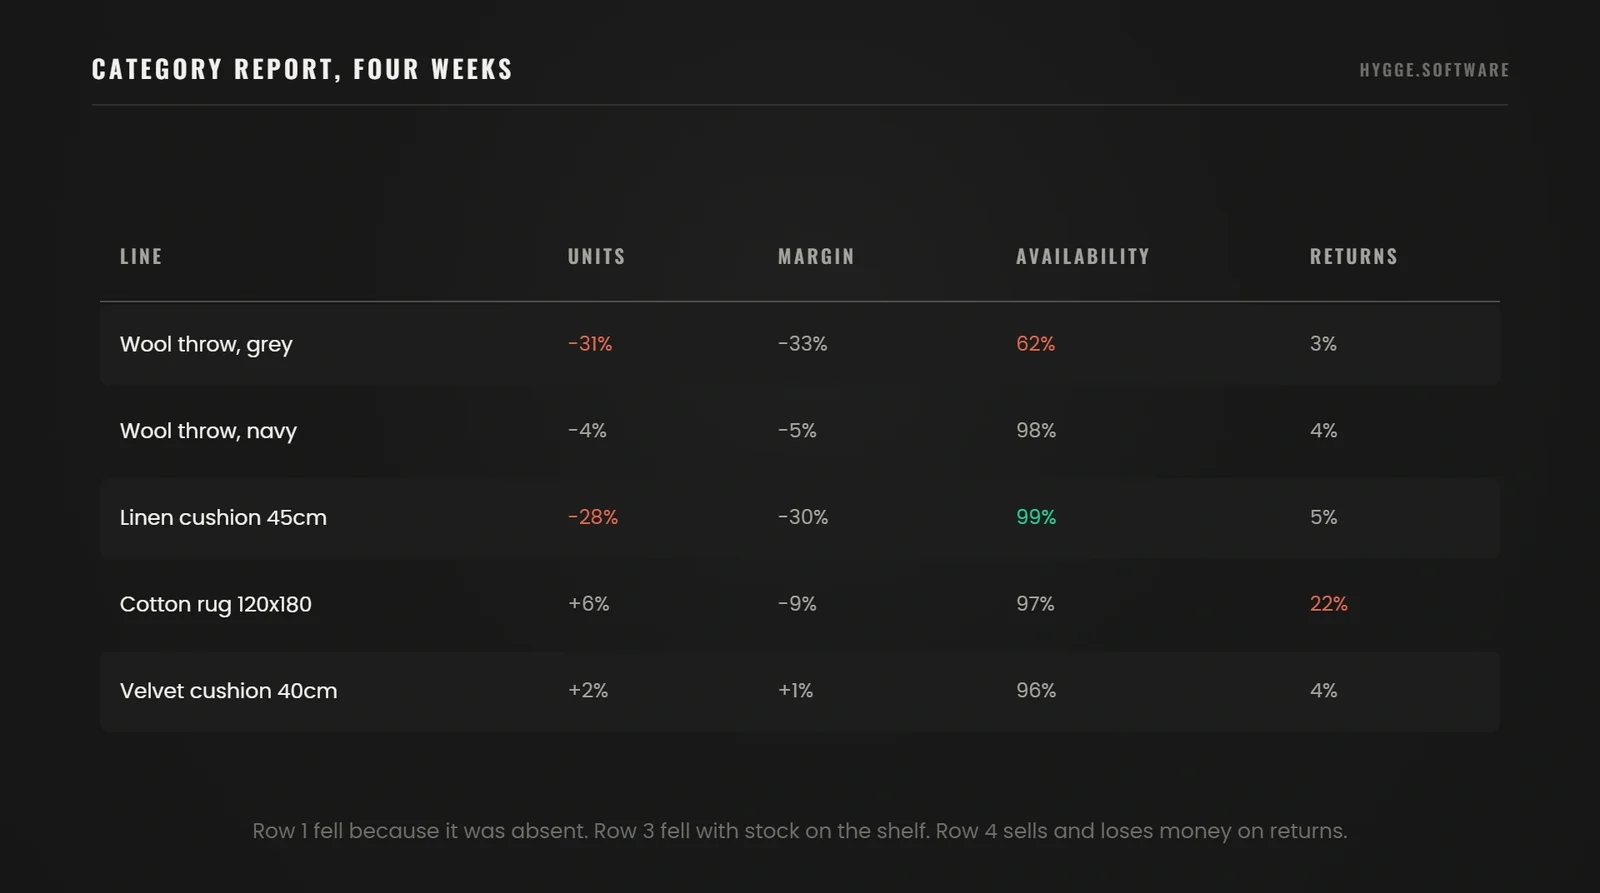
Published retail analytics statistics are worth reading for direction and worth distrusting as benchmarks, because definitions differ between studies and almost none of them publish theirs. A short example of what the discipline is for. Sales of a line fell 31% in four weeks. Looked at alone, that reads as falling demand and leads to a smaller reorder. Joined with availability, it shows the line was on the shelf in only 62% of branches. The action reverses: the reorder goes up, and the question becomes why replenishment missed.
How Retail Analytics Supports Everyday Decisions
Most of the value in retail sits in five areas. Each one follows the same shape: a business question, the data it needs, the action it makes possible, and the measure that tells you whether the action worked.
Inventory and Demand Planning
Sales, current stock, supplier lead times and the seasonal pattern together answer what to reorder, how much and where to send it. The trap is well known and still common: sales figures measure what was available to buy, never what customers wanted. A line that sold nothing because it was absent looks identical to a line nobody wants, and only availability data separates them.
Add lost-sales estimation to any demand work, or the model will keep learning from its own stockouts.
Pricing, Promotions and Product Profitability
Discount decisions need gross margin beside unit sales, because the two move in opposite directions during a promotion often enough that one without the other is misleading. The useful view is per line: units, revenue, cost of goods, margin after discount, and return rate.
Returns belong in this view. A line with a 4% return rate and a line with 22% have different profitability at the same headline margin, and the second one is usually discovered late.
Customer Behaviour and Retention
Recency, frequency and monetary value remain the first segmentation worth building, and they need no machine learning. Cohort analysis by first purchase month answers whether newer customers behave like older ones, which is the earliest warning that acquisition quality has shifted.
The limit to state plainly: loyalty data describes identified shoppers. Their share of transactions varies widely between schemes, so a conclusion about "our customers" drawn from loyalty data alone is a conclusion about the subset that joined a scheme.
Retail Marketing Performance
Retail marketing analytics joins campaign spend to orders, returns and repeat purchases. These get mixed here, and they need different methods.
Attribution divides credit between channels for conversions that happened. Google's own documentation describes its data-driven model as using "your account's data to calculate the actual contribution of each click interaction". It also notes that every model excludes direct visits from credit unless the whole path was direct. That is a distribution rule, and a useful one.
Incrementality asks a different question: would this sale have happened anyway. Attribution cannot answer it, because every model divides credit among touchpoints that preceded a conversion. A holdout group or a comparable test market can.
Source: Attribution models, Google Analytics Help, read October 2026.
Store Traffic, Conversion and Staffing
Footfall, transaction count, basket size and staff hours together answer whether a branch is underperforming on traffic or on conversion, which are different problems with different fixes.
One definition has to be settled first. A door count records visits, and one person can make several. Staff entering, a customer stepping out to take a call and a browser returning after lunch all add to the count. Compare that number to unique customers and the conversion rate goes wrong in a direction nobody notices. Settling it is the first job in any retail software development that touches store data.
The Decisions and the Data Behind Each
A compact view of the five areas. The subsections above carry the limits; this is the shape.
Inventory and demand
Question: what to reorder and where to send it. Data: sales, stock on hand, lead times, availability history. Action: reorder quantity and allocation. Measure: availability rate and lost sales estimate.
Pricing and promotions
Question: did the discount pay. Data: units, revenue, cost of goods, returns. Action: continue, change the depth, or stop. Measure: gross margin per line, after returns.
Customer behaviour
Question: who is drifting away. Data: identified purchase history over time. Action: a targeted contact, or a product fix. Measure: repeat purchase rate in an agreed window.
Marketing performance
Question: which spend produced sales that would otherwise not have happened. Data: campaign cost, orders, returns, a holdout group. Action: shift budget. Measure: incremental margin, never attributed revenue alone.
Store traffic
Question: is the branch short of visitors or losing them inside. Data: footfall, transactions, basket, staff hours. Action: staffing or layout. Measure: conversion rate on a stable visit definition.
The Sales Number Only Records What Was Available to Buy
Hygge puts availability beside sales in the first report it builds.
Yevhenii SukhovCTO & Co-Founder
"The sales number is the one everybody trusts and the one that lies most often, because it only ever records what was available to buy. We put availability next to it in the first report we build, and the order-cutting conversation starts from there."
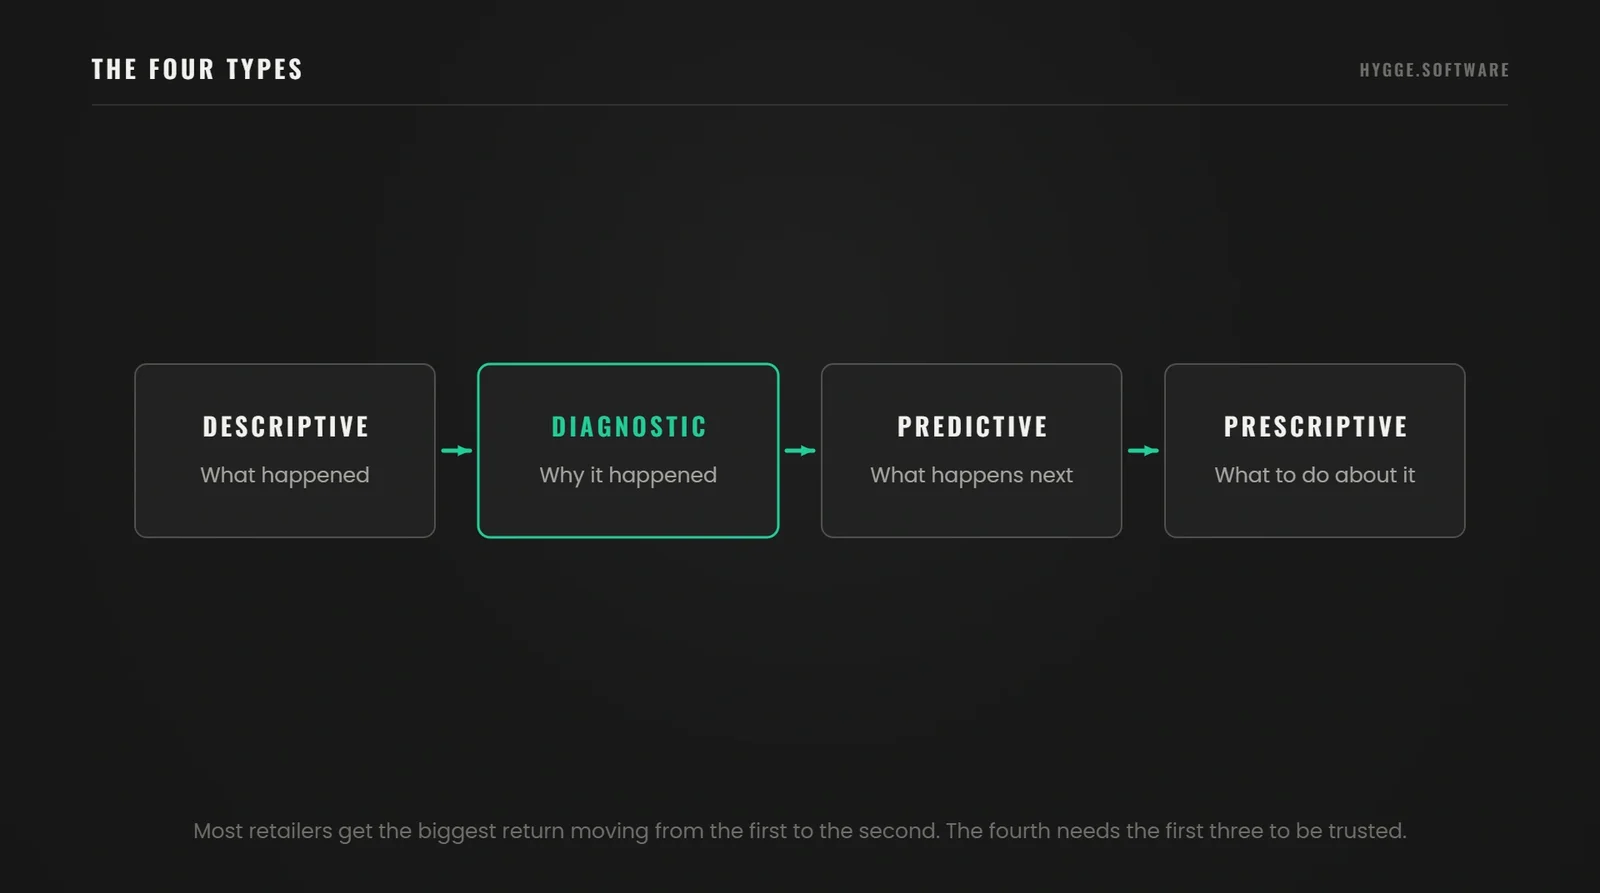
The Four Types of Retail Analytics
The four types describe how far retail industry data analysis goes. None of them names a tool. One example carries all four: sales in a category fell 9% last month.
Descriptive analytics states the fall and breaks it down by store, channel and line. It answers what happened and it is where most retail reporting stops.
Diagnostic analytics joins that to availability, price changes, promotions and marketing spend to narrow the cause. It answers why. Most of the value in data analytics in retail industry work sits here, because a cause you can name is a cause you can act on.
Predictive analytics estimates what happens next: expected demand per line per store, or the probability that a customer buys again this quarter. It needs history and it needs a baseline to beat.
Prescriptive analytics recommends the action and, in the strong version, takes it: a reorder quantity sent to the purchasing system, a replenishment transfer between branches. It needs the first three to be reliable, which is why it is seldom the right place to start.
Vendor reports on data analytics in the retail industry seldom separate these four, so their adoption figures travel badly between businesses. Most retailers get the biggest return by moving from the first to the second. Analytics in retail industry projects that jump to the fourth usually produce recommendations nobody trusts enough to follow.
What Data Do Retailers Need, and Can You Trust It?
In data analytics for retail, the decision you picked sets the data you need. Start from one decision, list the minimum that answers it, and check that minimum properly.
Connect Sales, Inventory, Customer and Marketing Data
For most retail questions the minimum is four sources. You need transactions from the till and the online store, stock positions by location, a customer identifier where one exists, and campaign cost by channel and date. Product and store master data joins them, which is why those two are the first things to fix.
Reconcile Definitions, Returns and Reporting Periods
Two reports disagree on revenue for the same handful of reasons. Tax is included or excluded, and discounts apply at line or basket level. Returns are deducted in the period of sale or the period of return, and cancelled orders are counted or dropped. Currency conversion dates and time zones split a trading day differently. Each metric needs one written definition, one owning system and one refresh rule, and the definition belongs beside the number on the screen. Most of that work falls to data engineering services, well before any dashboard exists.
Protect Customer Data and Control Access
The ICO sets seven principles under the UK GDPR, and four of them shape an analytics build directly. Purpose limitation means data can be reused only for compatible purposes. Each new analytics use needs a recorded check. Data minimisation requires what you hold to be "adequate, relevant and limited to what is necessary". Storage limitation means personal data is kept in identifiable form no longer than necessary. Accountability puts the burden on you to demonstrate all of it.
In practice, a retail customer data set for analytics holds identifiers and behaviour without full payment details. Access is granted by role, with a retention rule attached to each table. Where the sources sit in separate systems, system integration services connect them before the reporting layer reads from them.
Source: A guide to the data protection principles, ICO, read October 2026.
Readiness Checks for the Reporting Layer
Run these on the minimum data set for your chosen decision. Each one has failed a real project at least once.
Completeness
Every store and channel present for every day in the period, with gaps shown as gaps and never as a silent zero.
No duplicates
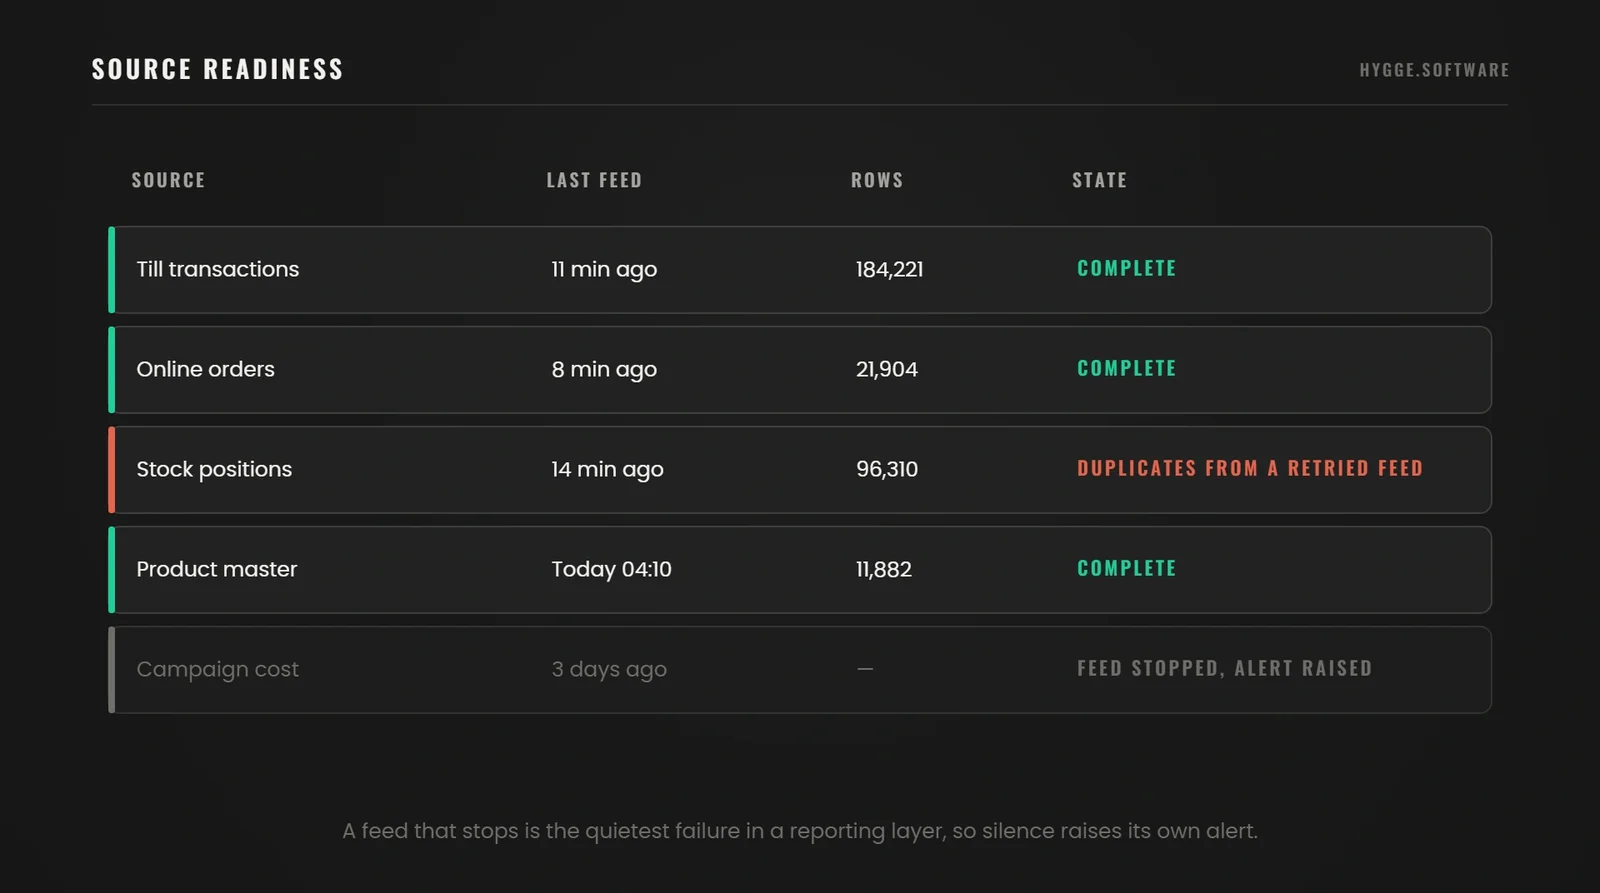
One transaction appears once. Re-sent files and retried integrations are the usual source.
Matched identifiers
One product, one store and one customer carry the same code in every system, or a documented mapping exists with a named owner.
Agreed definitions
Revenue, margin, a visit and an active customer each have one written definition, visible next to the figure.
Freshness
The report states when the data was last updated, so nobody argues from a stale screen.
Access by role
Who may see customer-level data is decided at the design stage, with a retention rule per table.
Two Reports Disagree Because Nobody Wrote the Definition Down
Hygge settles metric definitions in week one and shows them beside the figure.
 Zinaida Shelomkova
Head of Delivery
"When two reports disagree on revenue, nine times out of ten nobody has written down whether returns belong to the month of the sale or the month of the return. We settle that in week one and put the definition on the screen beside the number."
Find Out Why Two Reports Disagree
Send the two figures that will not reconcile and the systems they come from. You get a written answer on where the definitions diverge and what has to change to make them agree.
Which Retail KPIs Should You Track?
A short list beats a long one, and every KPI needs its limit written beside it. These are the ones that earn their place in most retail analytics examples.
Sell-through rate is units sold divided by units received in a period, and it tells you whether buying matched demand. Its limit: it says nothing about margin, so a line can sell through at a loss.
Availability, or on-shelf availability, is the share of lines present where a customer could buy them. Its limit: a system figure above zero does not mean the item is on the shelf, which is the gap connected devices are usually bought to close.
Gross margin return on investment is gross margin divided by average inventory cost, and it rewards stock that turns. Its limit: it punishes deliberately deep stock in high-service categories.
Conversion rate is transactions divided by visits, and it is the single most definition-sensitive number in retail. Its limit: it is only comparable where the visit definition is identical across branches and periods.
Repeat purchase rate is the share of customers who bought again inside an agreed window. Its limit: the window has to match the category's purchase cycle, so one figure across a mixed assortment hides more than it shows.
Return rate by line is returned units over sold units. Its limit: it lags, so a recent line always looks better than it is.
What a Useful Retail Analytics Dashboard Looks Like
A report is useful when it lets someone notice a problem, size it, and choose an action without opening a second tool. That rules out most dashboards, which show totals and stop.
Match the Dashboard to the User's Decisions
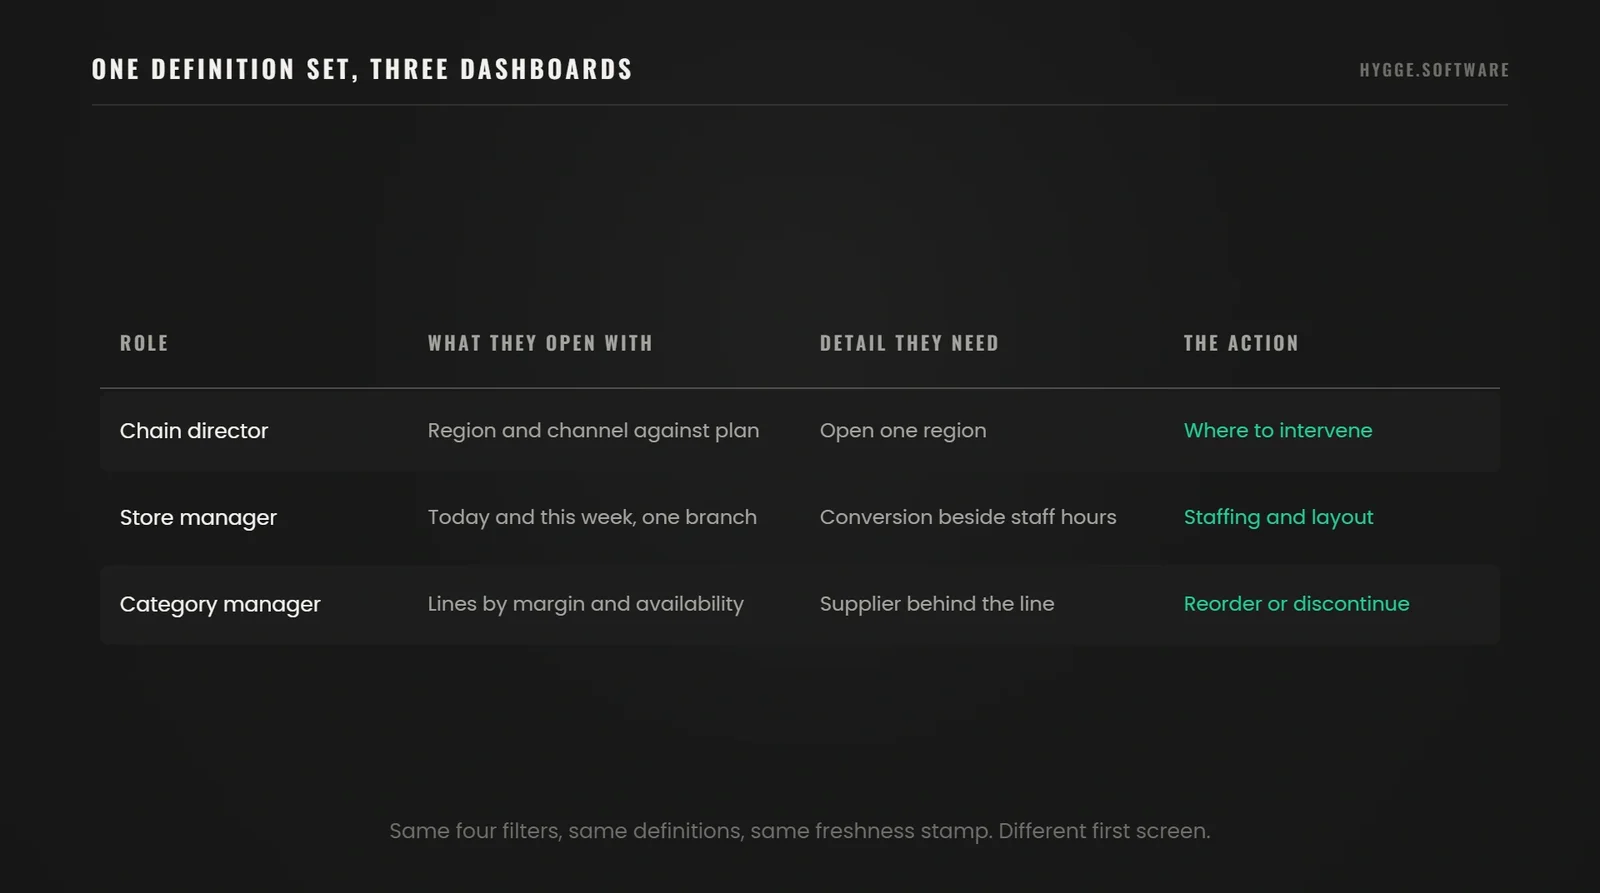
A chain director needs performance by region and channel against plan, with the ability to open one region. A store manager needs today and this week for one branch, with staffing and conversion beside each other. A category manager needs lines, margin, availability and returns, with a supplier view behind them.
All three need the same four filters, period, store, channel and category, and all three need the time of the last update on screen. Different roles, one definition set.
Investigate a Promotion That Raised Sales and Cut Profit
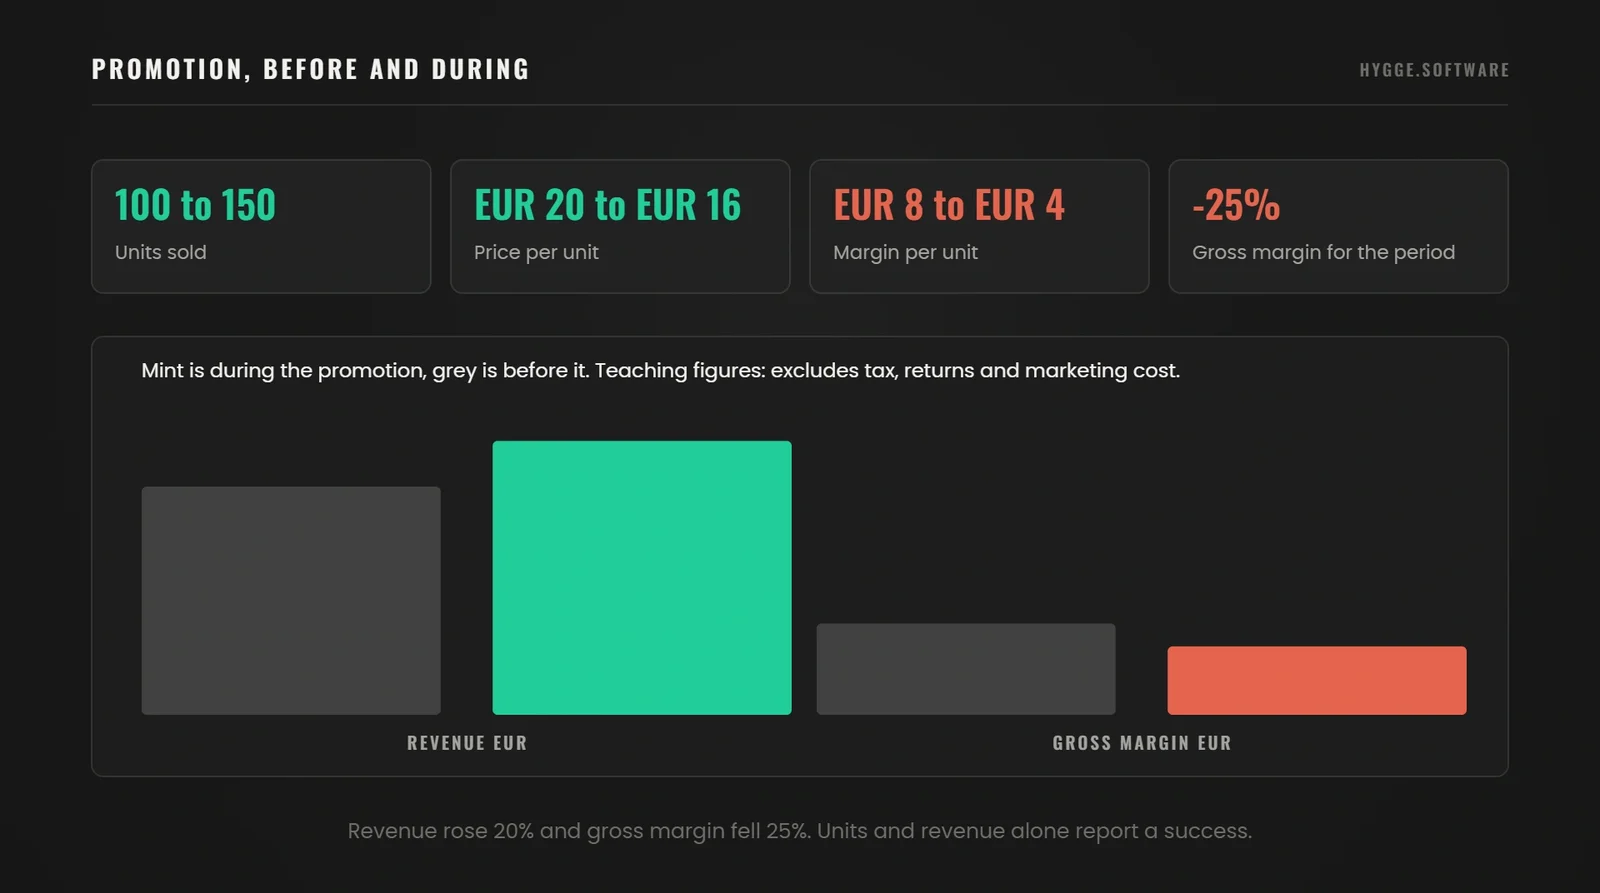
These are teaching figures, made up for the example. Before the promotion, 100 units sold at €20 with a cost of €12. Revenue €2,000, gross margin €800. During the promotion, 150 units sold at €16 with the same €12 cost. Revenue €2,400, gross margin €600.
Units rose 50% and revenue rose 20%, while gross margin fell 25%. A dashboard showing units and revenue reports a success. The same dashboard with cost of goods beside them reports a decision to review.
What the figures do not establish is that the promotion caused the change. Seasonality, a competitor's stockout and a marketing campaign running at the same time are all live explanations, and separating them needs a control group or a comparable period. Treat the arithmetic as the trigger for an investigation.
Figures exclude tax, returns, marketing cost and any other expense. A business intelligence and reporting layer that shows cost beside revenue turns this check into a routine one.
Build the Report That Answers the Next Question
Send the decision you need to support and the systems the data sits in. You get a view of what the report has to show, where the definitions have to be agreed, and what can be built first.
How to Implement Retail Analytics and Measure Its Impact
An analytics project is finished when a named person changes what they do because of a number. Everything before that is preparation.
Start with One Decision and a Baseline
Pick a problem with a cost attached: lines unavailable in branches that sell them, or promotions whose margin nobody checks. Name the person who will act, write down what they do today, and record the current figure before anything is built. Without that baseline there is no way to tell later whether the work paid.
Choose the Simplest Analytics Setup That Fits
The three routes are judged on the same criteria. Count the sources to join and the calculations needed, then check how fresh the data must be. Add who may see what and what maintenance costs.
Built-in reports in a system you already run are the cheapest form of business analytics in retail, and they stop at that system's boundary. A shared analytics platform over a small warehouse joins sources and is where most retailers land. Custom development fits a calculation the market does not model or a scale that breaks the alternatives.
Pilot the Workflow and Assign Ownership
Run the report with one category or a handful of branches for a full cycle. The test is behavioural: does the named person open it, act on it, and stop keeping their own spreadsheet. A report people read beside their old spreadsheet has failed, whatever the data quality.
Evaluate Business Results Before Scaling
Compare against the baseline and, where you can, a control group of similar stores. Account for seasonality, assortment changes and promotions running at the same time, and subtract the cost of the system. Analytics rarely deserves credit for the whole movement, and claiming it is the quickest way to lose the budget next year.
How Hygge Runs a Retail Analytics Project
These rules shape every reporting project we take.
One decision, named owner, recorded baseline. We will not start a dashboard without all three, because a report with no decision behind it becomes a screen nobody opens.
Definitions before pipelines. Revenue, margin, a visit and an active customer are written down and signed off in the first two weeks. Each definition is displayed beside its figure in the finished report.
Availability beside sales, always. Any view of what sold carries what was available to sell, so nobody cuts an order because of a stockout.
The freshness stamp is a feature. Every screen states when its data last updated, because an argument from a stale number costs more than a late refresh.
Handover inside the build. The metric dictionary, a named owner per source, and an alert when a feed stops arriving.
Two published projects show the pattern. On the PlayFusionLabs CRM we put sales, projects and finance into one database in about two months and removed the reconciliation between separate tools entirely. It worked because every record was given one owning system at the data-model stage. A retail reporting layer needs the same first step. On Smarter Humans we took 93% off a twenty-second document load, and the reason that mattered is the one that applies to dashboards: people stop using a tool that makes them wait, and a report nobody opens produces nothing whatever it contains.
Our Delivery Record
Numbers published on hygge.software and in the case studies linked above.
The Parallel Spreadsheet Is the Only Honest Adoption Metric
Hygge measures a reporting project by whether the old spreadsheet disappears.
 Alina Sukhova
CEO & Co-Founder
"The signal that a reporting project worked is that the parallel spreadsheet disappears. While somebody is still keeping their own version, the dashboard is decoration."
What Retail Analytics Costs and What Moves the Number
The estimate depends on the data more than on the tooling. It moves with the number of sources to join and how badly their identifiers mismatch. It also moves with how fresh the data has to be and how many definitions are contested inside the business.
The last one is the surprise. Joining four systems is engineering with a known shape. Getting finance, merchandising and marketing to agree what a sale is takes calendar time and no amount of tooling shortens it.
Split the number into build and running. The running line carries platform licences, warehouse compute, the people who maintain the pipelines, and the re-test every time an upstream system changes a field.
Duplicate Product Codes Predict the Effort
Hygge asks for a week of raw transactions before quoting a reporting project.
 Artem Petrov
CFO & Co-Founder
"We ask for one week of raw transactions and the product master before quoting a reporting project. The count of duplicate product codes predicts the effort better than the number of systems does."
What the Reporting Layer Costs to Run
Send the sources, one week of raw transactions and the decisions the report has to support. You get the split between one-time build and the monthly line, with the assumptions beside each number.
Figures in This Article
From the worked example above, from Google Analytics documentation and from ICO guidance, all read in 2026.
Retail Analytics FAQ
The questions retailers ask at the design stage.
 Can a small retailer start with spreadsheets?
How much historical data is needed for retail analytics?
Do all retail analytics reports need real-time data?
Can retailers analyse customer behaviour without a loyalty programme?
Is Google Analytics enough for an omnichannel retailer?
Does retail analytics require artificial intelligence?
Scope Your Retail Reporting Layer
Send the decision you need the report to support, the systems the data sits in, and the two figures that currently disagree. We will come back with what has to be joined, which definitions need settling and what can be built first.
Describe the Decision
The decision the report has to support, the systems that hold the data and the figures that disagree today.

Get a Data Review
Hygge checks the sources, identifiers and metric definitions, and names the gaps before any dashboard is built.
Receive a Scoped Plan
Sources, definitions, the first report, a timeline and a price for the build and the running line.