


Business Intelligence Development That Makes the Numbers Agree
Dashboards multiply faster than definitions. When revenue means one thing in the finance report and another in the product dashboard, the fix sits in the model underneath, in a semantic layer that defines each metric once and serves it to everything downstream.
What Dashboard Development Services Solve
Where reporting stops being something the business can act on. Two dashboards give two answers on the same number, the weekly report lands after the decision was made, and somebody is still exporting to a spreadsheet to check it. Data analytics services start by agreeing which number the company trusts.
The Same Metric Gives Two Answers
Finance and product each built a dashboard, each filtered differently, and the two numbers are both defensible. Meetings become reconciliation sessions.
- One definition per metric, written in a semantic layer every tool reads from
- Lineage from a figure on a dashboard back to the source rows
- Definitions reviewed in version control like any other code

Reports Run Against Production
Analysts query the operational database because that is where the data is, and a heavy report slows the application for customers.
- A warehouse fed on a schedule, with production left to serve the product
- Query paths sized for analysis
- Refresh timing agreed against how fresh each report has to be

Nobody Can Get an Answer Without an Analyst
Every question becomes a ticket, and the answer arrives after the decision was already made.
- Custom dashboards covering the questions asked every week
- Self-serve exploration over modelled tables, with row-level security per user
- Scheduled delivery so recurring reports arrive without being requested
The Pipeline Fails Quietly
A source stops sending, the dashboard keeps rendering yesterday, and nobody notices for a week.
- Pipelines that fail loudly, with alerts naming the source and the run
- Freshness checks visible next to every figure
- Tests on the model that catch a broken assumption before it reaches a chart
What Makes Custom Dashboard Development Hard
The charts are the easy half. What decides whether reporting gets trusted is the layer underneath: whether a metric resolves the same way for every consumer, whether the numbers are fresh enough for the decision, and whether a broken source announces itself. Hygge starts with what the business asks every week, works backwards to the model that answers it, and builds the pipeline last.

Where Data Analytics Services Apply
Sectors where a reporting gap costs money directly, and where Hygge has closed it. What changes between them is the number that decides the week: fill rate, utilization, margin per order, days to close. Custom dashboard development shapes the view around that number, and the source systems get modeled to feed it.

Retail & E-Commerce
Retail and e-commerce reconciling campaign spend, vendor billing and margin against the same orders.

Logistics & Warehouse Automation
Logistics operations measuring throughput, exceptions and carrier performance across sites.

Sales & Marketing Technology
Sales technology teams tracking pipeline, deliverability and conversion from the same source records.
HR & Recruitment
Recruitment platforms measuring match quality and time to fill across employers.

Healthcare & Staffing
Healthcare staffing tracking fill rates, credential status and shift economics.
The Stack Behind Custom Reporting Software
Reporting fails when it competes with the system it reports on, so analysis storage is kept separate from the transactional database. This stack is chosen so a heavy query leaves the people doing the work it measures at full speed.
Columnar storage sized for analysis, kept separate from the databases serving the product.
 Snowflake
 BigQuery
 ClickHouse
 PostgreSQL
Dashboard Development Services Track Record
Company numbers across every project, from the first audit through the years a system stays in service. Dashboard development services are judged on whether people still open the dashboard in month six. The audit at the start is what makes the delivery date and the price hold.
How Power BI Development Services Deliver a Reporting Layer
Start from the questions asked every week, work back to the model, build the pipeline last. That order means the first working report lands before the warehouse is finished. Each stage is checked against a number your team already knows by heart.
Question and source audit
2 weeksHygge collects the reports the business runs on, checks which sources can answer them, and records where current figures disagree. The output is a metric list, a scope and an exact price.
Warehouse and first models
3-4 weeksSources land in the warehouse on a schedule, with the first metrics modelled and tested. One dashboard goes live to prove the numbers against the current reports.
Semantic layer and dashboards
4-6 weeksMetric definitions move into the semantic layer, and the dashboards people read every week get built on top of it with row-level security applied.
Alerting and self-serve
2-3 weeksFreshness and row-count checks alert on failure, scheduled delivery replaces recurring requests, and analysts get exploration over the modelled tables.
Related Dashboard Development Services Work
Projects where the reporting gap was the problem the client was paying for. Each started with numbers that disagreed across systems and a team spending days reconciling them. What you see is the model that settled it and the decisions it unblocked.
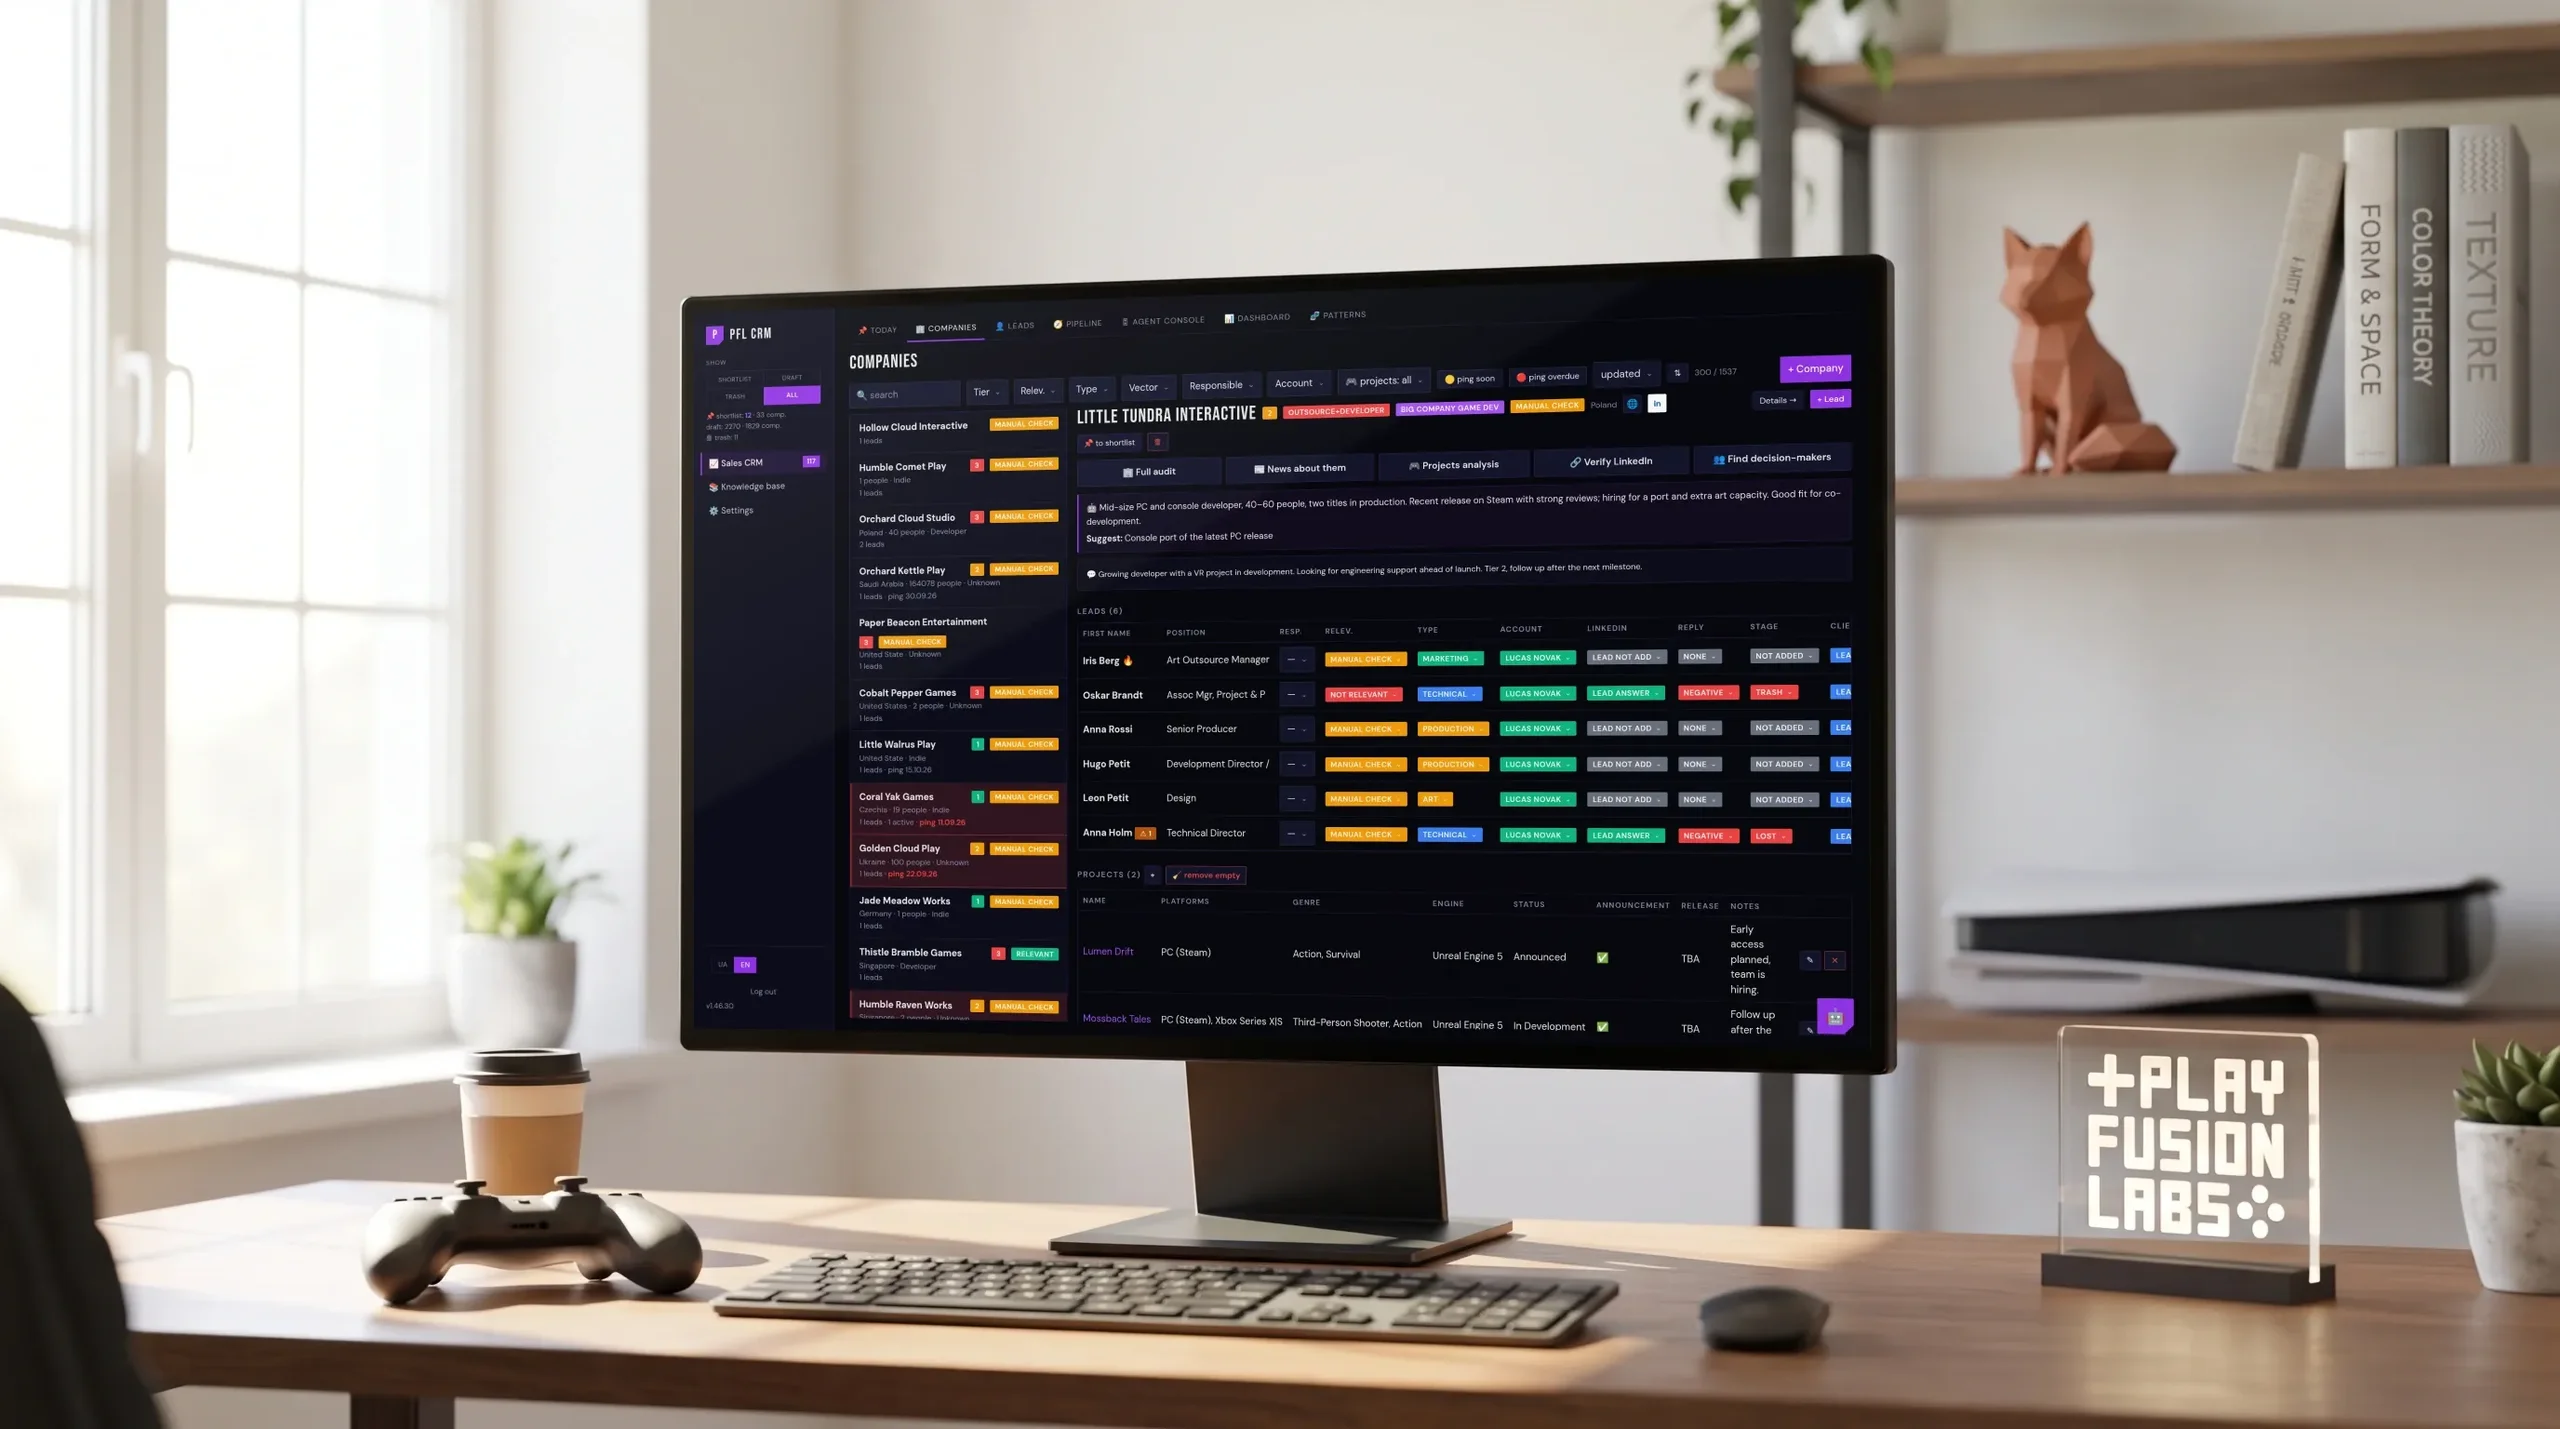
PlayFusionLabs CRM
Custom CRM development for a game studio. An agent researches companies, Today lists who to ping, and finance sits in one database.
- ~2 monthsFrom first call to daily use
- 150+Releases since launch
- 1 databaseFor sales, projects and finance
- $0In per-seat licences
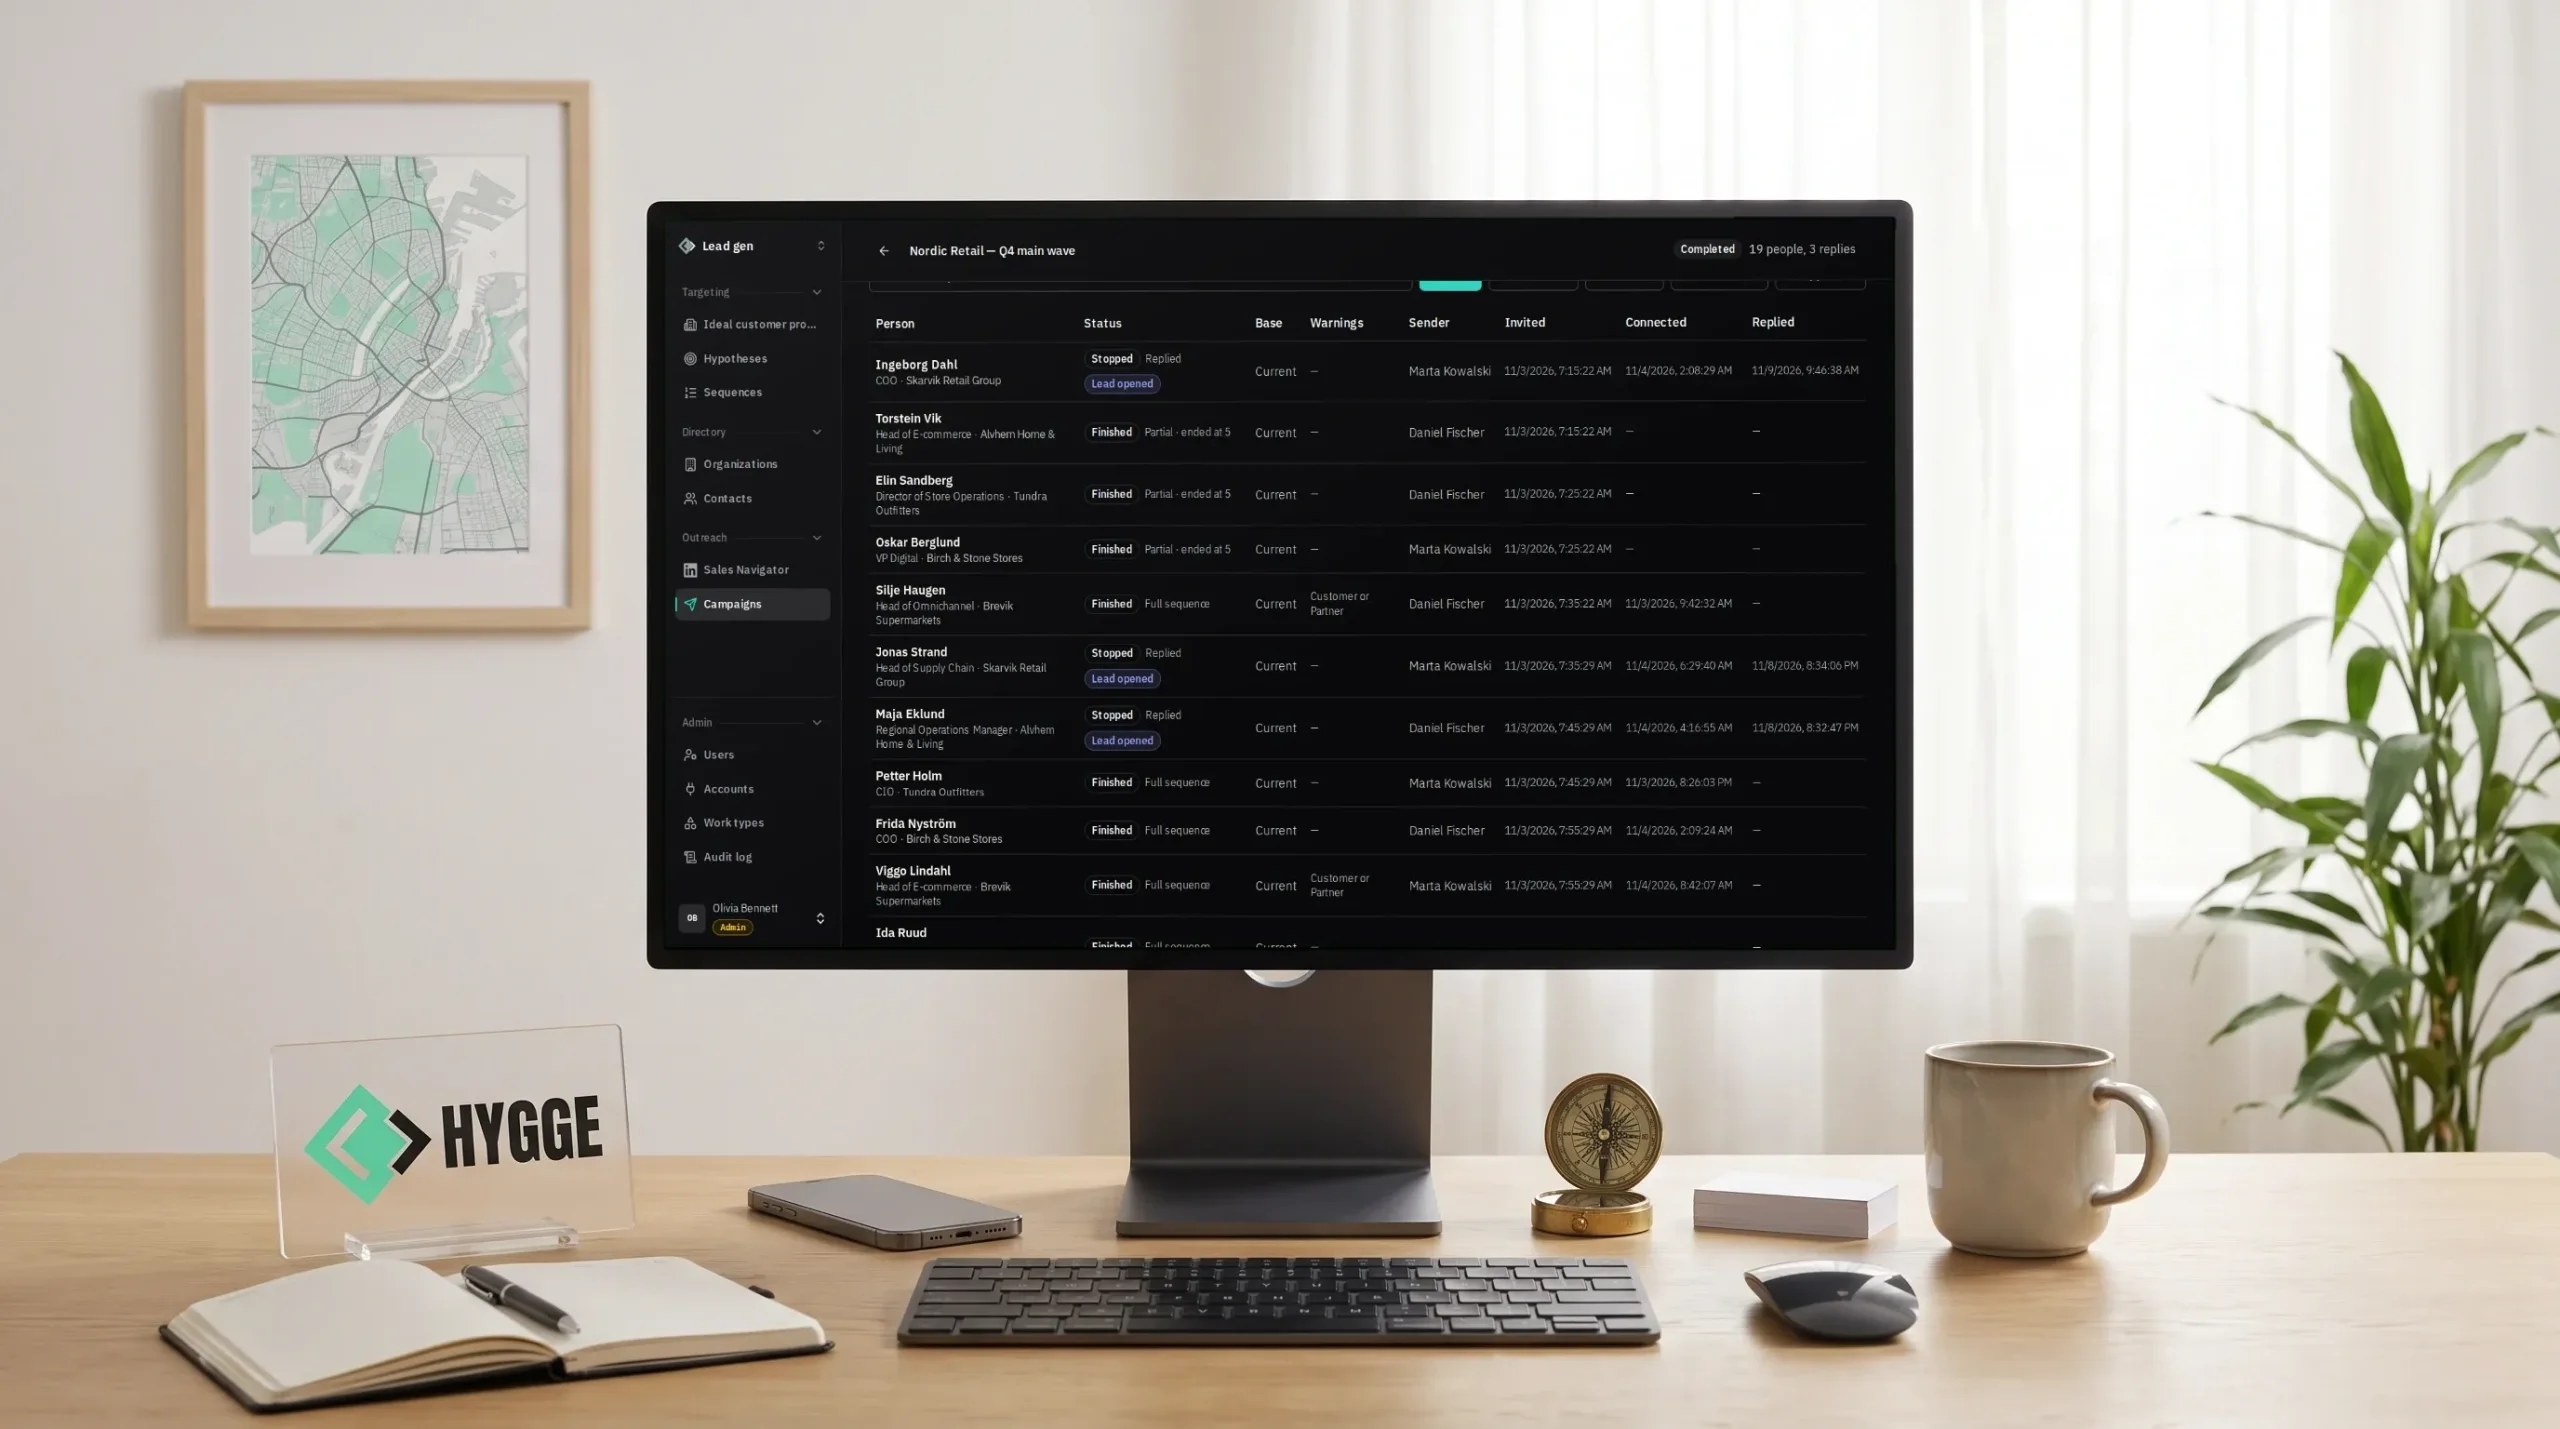
Hygge Lead Generation
Hygge's own outbound platform, where only approved hypotheses run campaigns. Every reply traces back to the targeting behind it.
- 5 toolsReplaced by one platform
- 0Scripted messages sent after a reply
- Every leadTraced to its hypothesis
- Per accountDaily and weekly sending limits
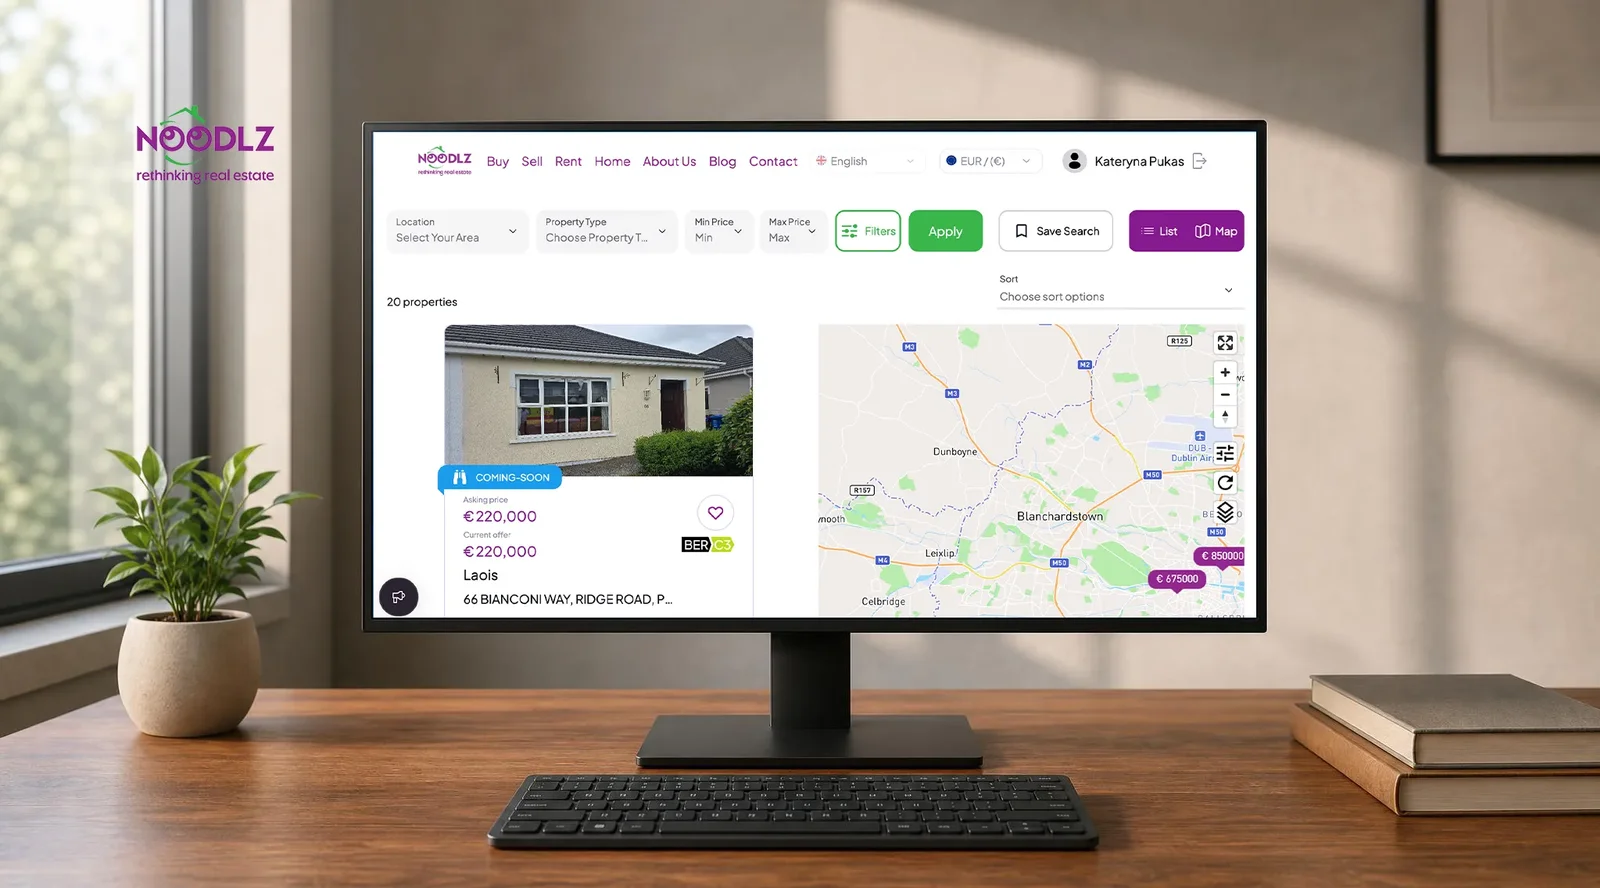
NOODLZ
Live auction software for an Irish agency network. Auctions moved off phone calls into one platform with verified bidders and a document vault.
- 1 platformReplaces auctions run outside any system
- 1 vaultReplaces contracts moving between inboxes
- 2+ yearsOf continuous delivery since 2024
Before You Commission Custom Reporting Software
Why the same metric gives two answers, how a semantic layer stops the argument, and when a warehouse is worth the cost. Power BI development services and a custom front end solve different halves of the same problem. Reading these early is cheaper than rebuilding a model in month four.
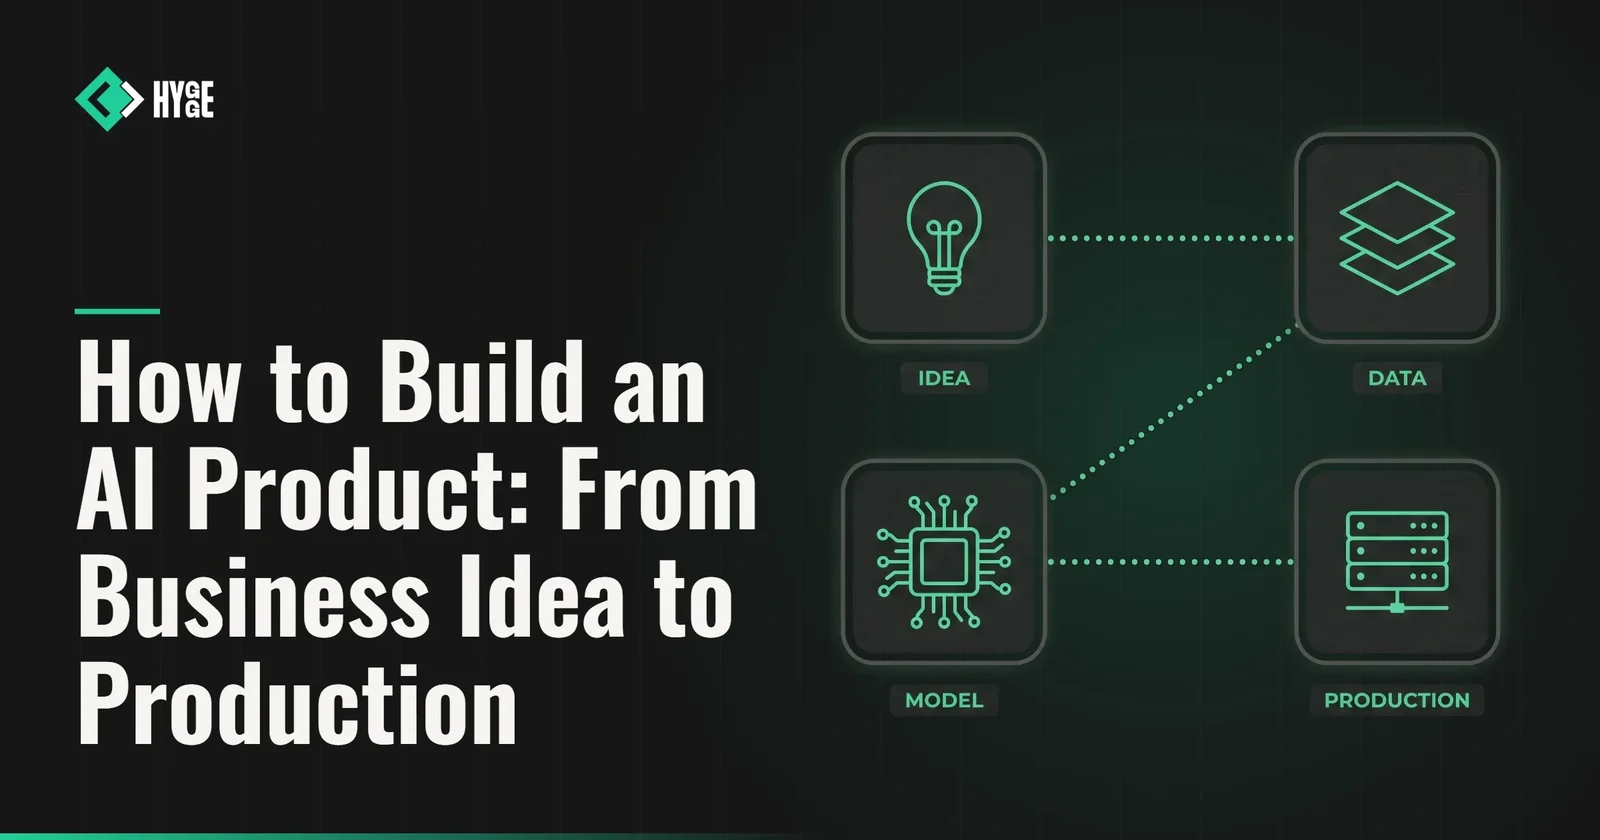
How to Build an AI Product: From Business Idea to Production
A practical guide to the AI product development process: validation, data readiness, architecture, team, timeline, cost and what breaks between prototype and production.
 Yevhenii Sukhov·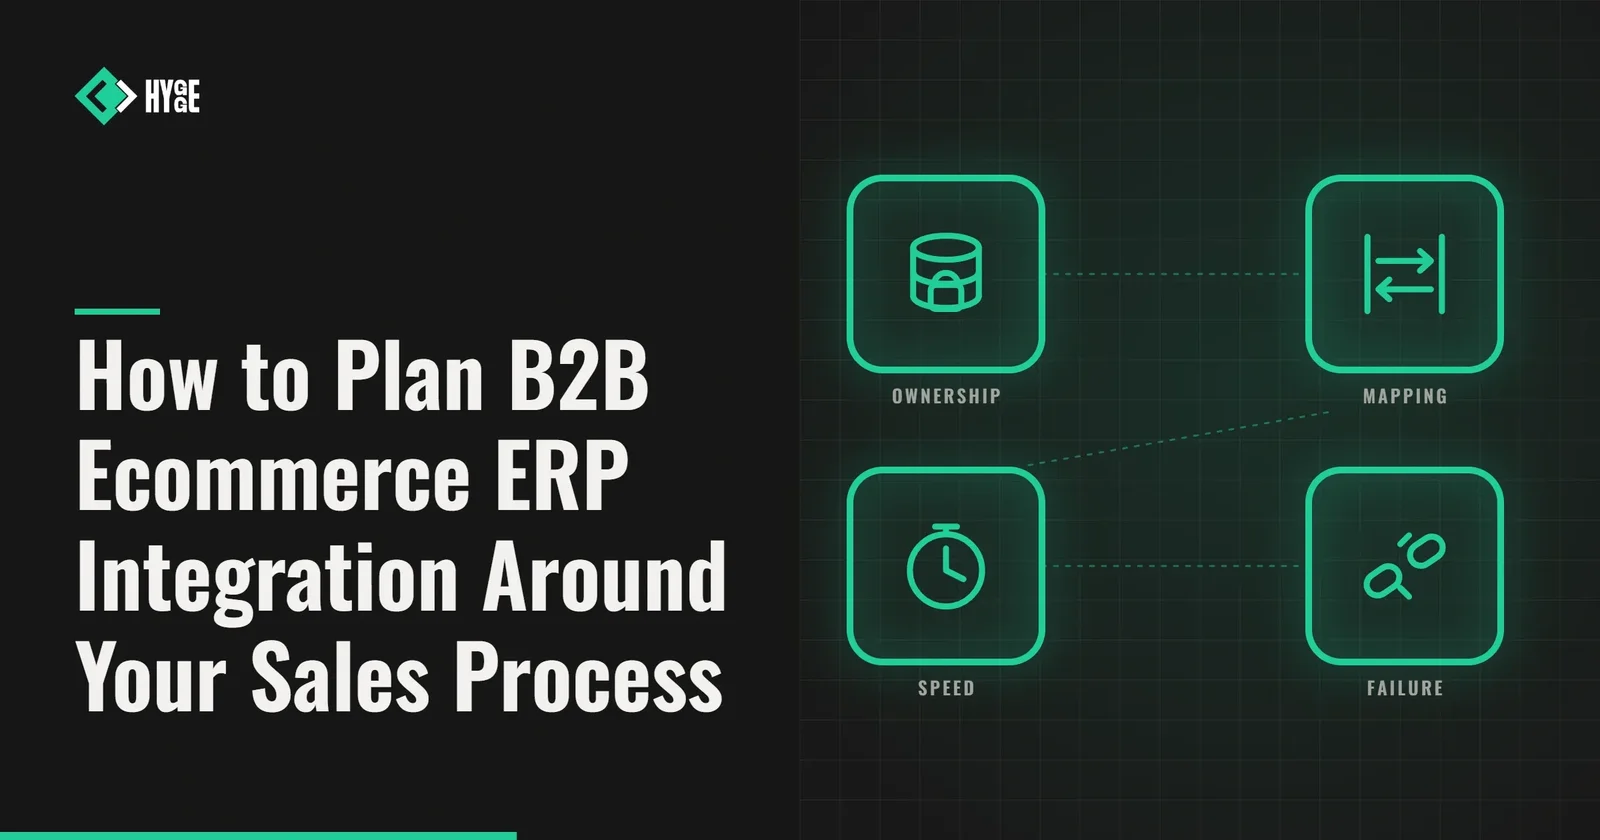
How to Plan B2B Ecommerce ERP Integration Around Your Sales Process
How to scope an ERP and B2B storefront integration: which system owns each object, how to pick between a connector, a platform and custom work, what must sync live, and the failure cases to test before launch.
Yevhenii Sukhov·Business Intelligence Development Services: Frequently Asked Questions
Whether you need a warehouse, how long a first working dashboard takes, and what happens to the reports you already run. The answers below cover cost, the tools that fit your stack, and who maintains the model after handover. Power BI development services and a custom front end solve different halves of the same problem. Power BI development services and a custom front end solve different halves of the same problem.
 What is business intelligence?
What is BI in business?
How does business intelligence work?
What is the main purpose of business intelligence?
Why do we need business intelligence?
Why do two dashboards give different numbers for the same metric?
Do we need a warehouse, or can we report on production?
Which BI tool should we standardise on?
How fresh does the data have to be?
How much does business intelligence development cost?
What happens when a source system changes?
Can you work with the pipelines we already have?
Business Intelligence Development Services Start With the Numbers That Disagree
Tell us which reports the business runs on and where two figures conflict. You get an audit, a metric list, a scope and an exact price.

Tell Us Which Reports Matter
Share the dashboards and spreadsheets the business decides from, and the figures that come out different depending on who runs them.
Get a Question and Source Audit
Hygge checks which sources can answer each question, where the definitions diverge, and what the warehouse has to hold.
Receive a Metric List and an Exact Price
A written scope with the metric definitions, the model, the refresh cadence, the timeline and the cost.